
Dear Reader,
I am a big fan of Wait But Why, especially because the posts are exquisitely deep and diverse. Some of them (link, link and link) are about keeping track of how many days we have left. The idea is simple and powerful: assuming you will live to be 90, draw a square for each week and start crossing them off. This simple visualization can help you make decisions about how to spend your time. I started wondering – “How can I use it at work?”. Creating an actual board with the squares wasn’t the best idea since I don’t know how many squares I should draw. However, my mind kept working in the background and I finally came up with the answer.
It was the end of March 2017. For the previous month, I didn’t have a lot of interesting tasks at work and it made me think: am I really happy with the job I have? There are a lot of great things at Estimote; to name a few: ambitious people, great culture and cutting-edge projects. However, is it really something that makes me feel fulfilled and helps me to achieve my personal goals? This is a hard question to answer because there are so many factors which make you feel a certain way about your job or company and it’s hard to measure this feeling. If my goal was to have a decent salary, looking at the bank account is a solution. But if my goal is to grow and find fulfilment, it is much harder, since it’s not obvious what “growth” and “fulfilment” even mean.
A simple solution
I was thinking about it for few weeks and finally I thought about one of our company sayings: “Make it work, make it better” and I decided to create something and then upgrade it. These were my assumptions for the system:
- simple
- easy to use
- low tech (notebook)
I decided to use a notebook and have a 2x2 square for each day. There are 4 squares to fill in, so I had to come up with four categories. Since answering a question like “Was I happy today?” is too general, I decided to go with something more specific. This is what I came up with:
- Productivity – Was this day a productive one? Have I used my time in a way that I am satisfied with?
- Development – Have I learned something new? Have I learned/improved a useful skill?
- Frustration – Were there any frustrating situations today?
- People – Have I helped someone today? Have I done something for others?
Why are these important for me?
- Productivity – I feel bad if I’m not productive
- Development – I want to learn, gain experience and build my career capital.
- Frustration – If there is too much frustration, something is definitely wrong.
- People – Helping others is one of the most rewarding things I can do. So if I had an environment where I’m unable to help my co-workers, I probably wouldn’t be very happy with that.
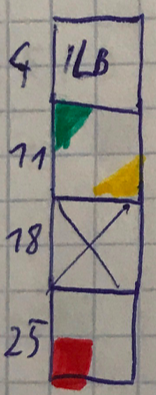
So from that day on, at the end of each day I color each square. Since for me simple yes/no answers give to little information, I decided to use yes/somewhat/no scale color coded as full/half/none. Example from the beginning (this is March):
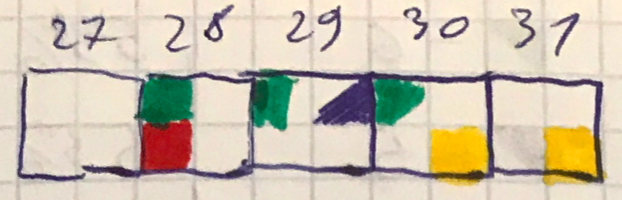
So on the 28th I was very productive and very frustrated – there probably was a bug I was trying to fix for the whole day and I have finally managed to do it. On the 29th and 30th I felt quite productive. On the 29th I even learned something new and the last two days were full of helping others to solve their problems.
A few improvements
Avoiding bias
Marcin, my team leader, suggested that I shouldn’t be biased by the square from the previous day. So I decided to have 5 pages, one for each day of the week.
Tags
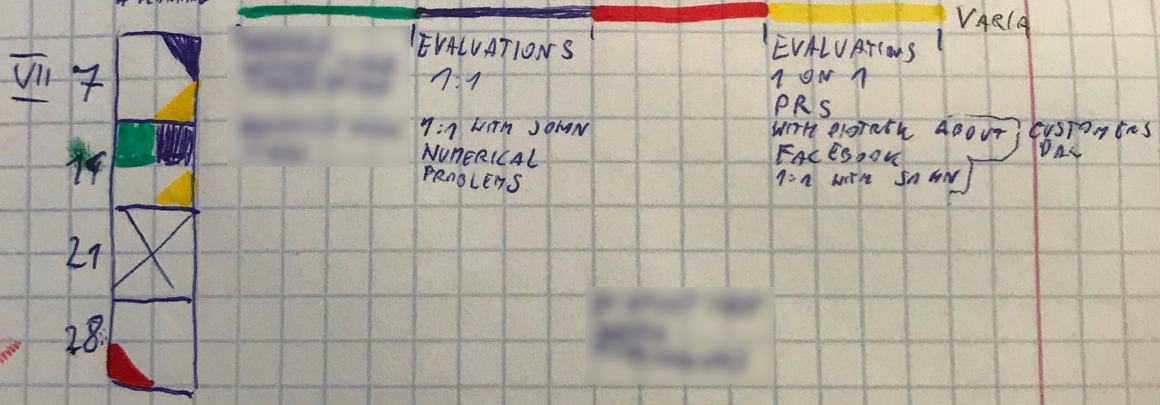
This is a very simple system, but after a week I am not able to recall why I scored a given day the way I did. So after about 2 months I started adding tags. At first simple tags:
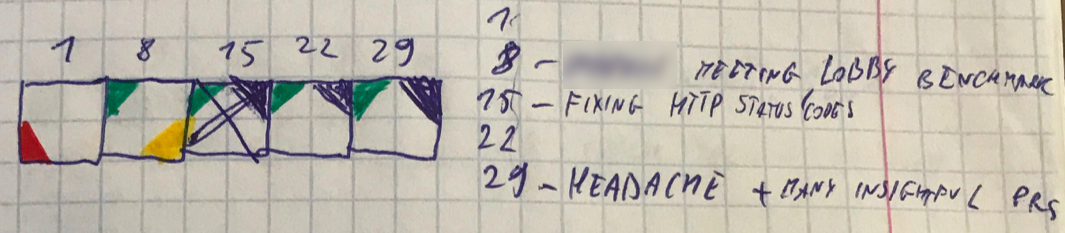
then in a more organized way:
I have not used tags for anything yet. But I hope that when one day I will have some use for them, I will have enough historical get what I want.
Statistics
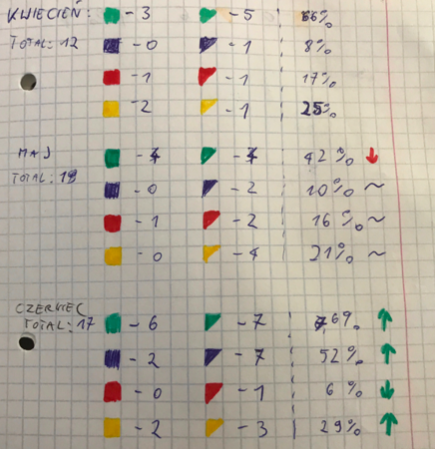
At the end of each month, I create simple statistics – I count the days with a given color in a given month and look how it changes over time. As you can see, my productivity in May was lower, while other metrics stayed pretty much the same. And then, in June, everything was better (the one arrow pointing down is green since it’s good that frustration was lower.).
The question arises (especially in the beginning) what is the baseline? If I feel productive 50% of days is it a good or a bad sign? Are 4 frustrating days in a month too many, or is it normal? I think to answer this question you need at least 3 months of data, maybe more. Also, if someone else was using this system, it would be hard to compare, since everyone has different thresholds.
ILB
There are some days which scored 0 for each metric. On such day I write ILB – Intentionally Left Blank, to avoid confusion later (“What about this day? I forgot to fill it or what?”). When I forget to fill in a day or I’m not at work that day, I just cross it out.
Other implementations
App
One comment I often get is “You should write an app.”. The main reasons I don’t are:
- I don’t like writing apps;
- It takes some time to write an app, especially when you don’t like it;
- The system is still in the development phase and it’s much simpler to change something on paper;
- There is something about doing it in a notebook that makes me more… serious? conscientious? Not sure what exactly, but in this case, paper has more “soul” for me.
Spreadsheet
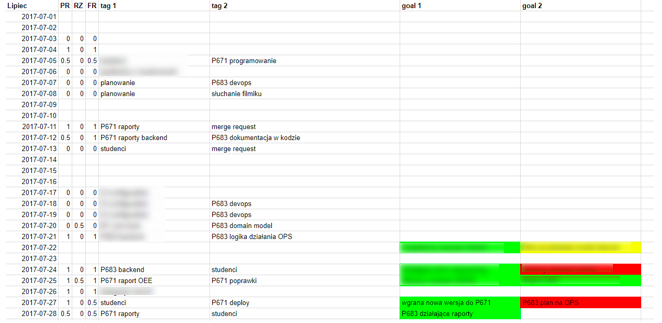
A friend of mine implemented this system in a spreadsheet. He has 3 columns: Productivity (PR), Development (RZ) and Frustration (FR). The main difference is that frustration is actually “lack of frustration”, so it’s good when it’s full. He also has two tags for each day, and after some time, he also added two goals for each day.
Conclusions
So what are the benefits of having a system like that?
Consciousness and perception
I am more conscious of how I spend my time at work and I can react accordingly. Example: I feel very satisfied with my job because I’m very productive. However, for the last month I haven’t learned anything new – so I know I should change something. Without tracking, I have to trust my feelings. With tracking, I know that for the last 20 days there were only 2 I have actually learned something new, and that’s bad.
Evaluating changes
It helps to see how changing teams/positions/responsibilities affects your productivity/frustration/job satisfaction.
Negotiation
It’s probably a useful tool for negotiation with your boss, but I have not tried it yet. However, I really believe our CEO/CTO will be much more willing to agree with me if I have data to support my claims.
Using it at scale
I have no idea how many people would like to use this system or how it would change if the data were not private and anonymous. But I am sure it would be an interesting experiment.
What are the costs?
- 1 minute per day to write it down
- 10 minutes per month to create statistics
- a notebook
- 4 markers in different colors
- a pen
Update
Actually, after a couple of months of doing it with pen and paper, I also migrated to a spreadsheet. In the end it turned out to be easier to analyze and maintain :)
Feedback please!
- If you like this idea, please write me.
- If you have some ideas for improvement, don’t hesitate.
- If you think I’m writing like a 6th grader, tell me how I can improve.
- If you have any other remarks, let me know.
- If you see a typo, there is a way for you to fix it.
- If you have anything you want to share with me, do it.
I really appreciate every piece of feedback you give me. Without it I won’t know if I should write more and I won’t know what I should improve.
Have a nice day!
Michał